Rev 22:7
Facebook:
The following graphs depict the significant major earthquakes recorded since the Richter scale was developed in 1935. According to the National Geophysical Data Center, earthquakes considered significant must meet at least one of the following criteria: "Moderate damage (approximately $1 million or more), 10 or more deaths, Magnitude 7.5 or greater, Modified Mercalli Intensity X or greater, or the earthquake generated a tsunami."
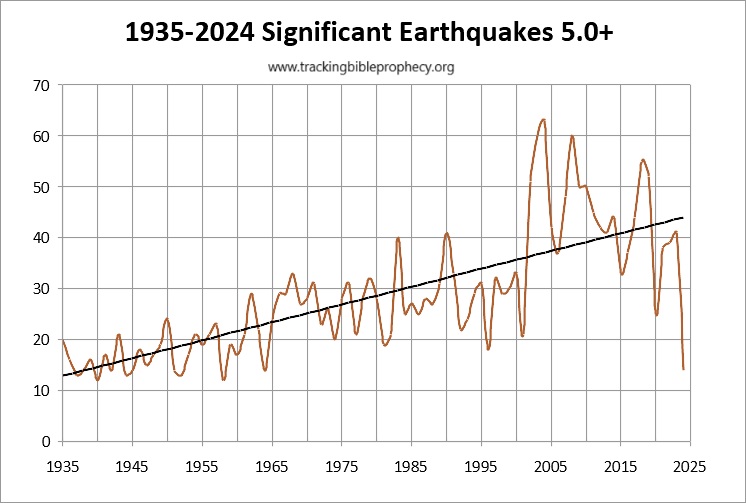
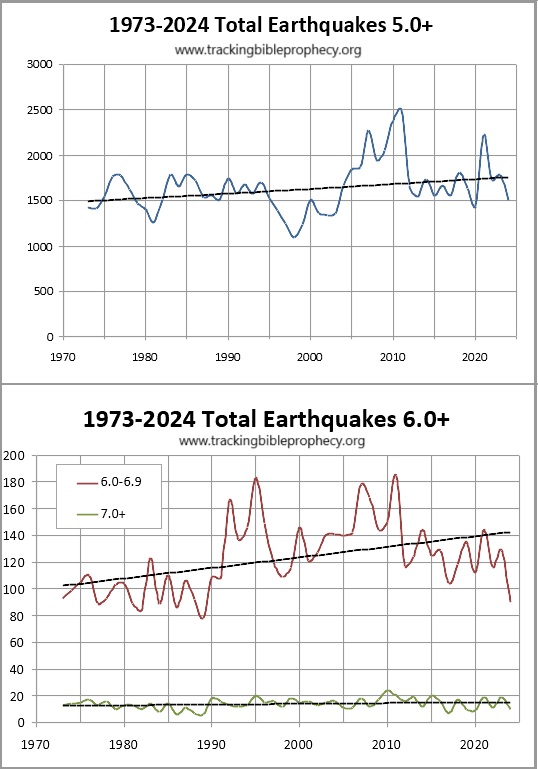
The graph below shows the total significant earthquakes per year, magnitude 5.0 or greater, with a trend line overlaid:
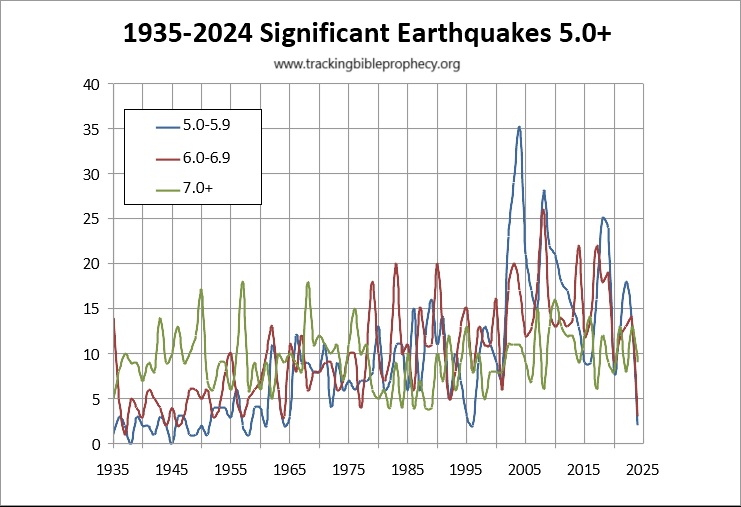
The following graph shows all the significant earthquakes from 1935, separated by magnitude:
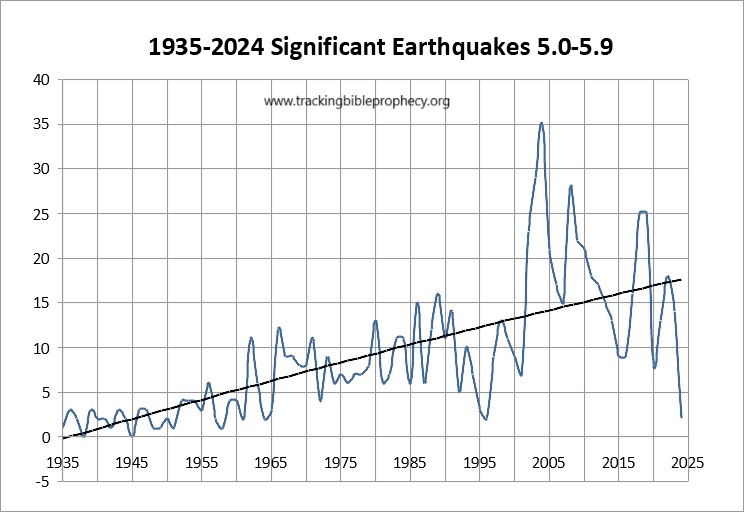
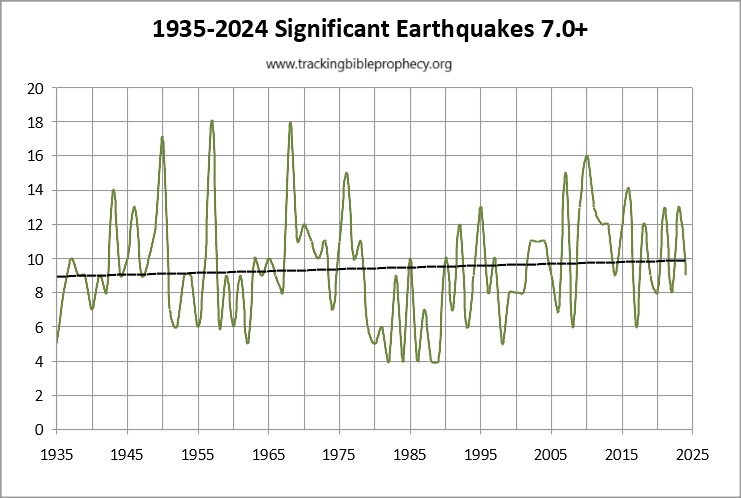
The following graphs show significant earthquakes since 1935, separated by magnitude with a trend line:
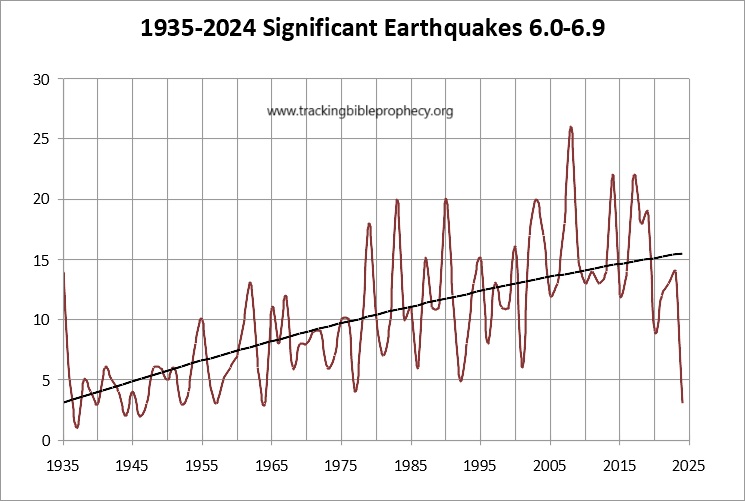
Data for all earthquakes globally is available online only back to 1973. When we factor in all earthquakes, magnitude 5.0 and greater, the trend is still on a noticeable increase, especially for earthquakes magnitude 6.0-6.9:
Data source: Global Earthquake Search
Conclusions
Earthquakes smaller than 5.0 in magnitude have not been included in this study due to an increase in data obviously tied to the broadening scope of seismic equipment in recent decades. In other words, because there are an increasing number of seismographs, the jump in data is reflecting the increase detection of smaller earthquakes. However, larger earthquakes are felt at further distances, so the data for moderate to strong earthquakes should, in theory, show us an accurate trend. It is interesting to note that other than the 7.0+ graph, the other graphs above show a marked increase in earthquakes starting around the time Israel became a nation in the 1940s.
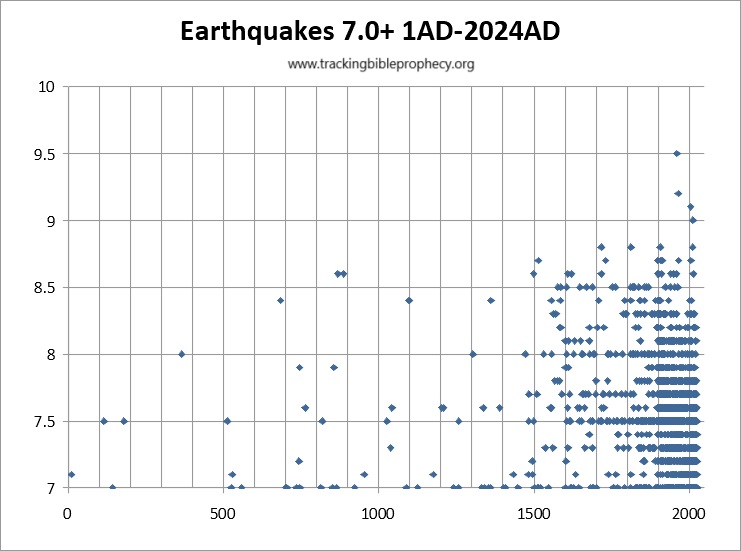
Even if the technology for earthquake detection is better today than decades ago, it is obvious that the general trend of moderate earthquakes, overall, is exponential. However, I found it interesting that the magnitude 7.0+ earthquake trend is flat. That being said, because these strong earthquakes typically make such a large impact, one can go back further in history to see if the there is a different trend that appears for strong earthquakes before 1935. Indeed, it looks like there is an increasing trend of strong earthquakes that started long before advances in technology, as shown below:
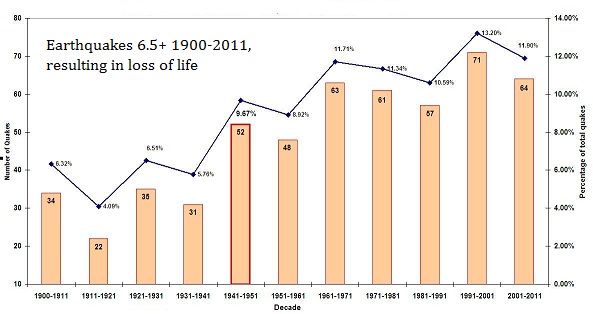
On a related note, a fellow watchman shared the following graph. They compiled the data from The Hive Group. The graph shows that there has been an increasing trend of earthquakes that result in loss of life over the past century, which follows both the trend in increasing population and increasing earthquakes in both frequency and intensity:
In closing, it certainly looks like earthquakes are behaving exactly like Jesus said they would; increasing in frequency and intensity like "birth pangs".
Click here to return to "Tracking the Birth Pangs."
Home About Me Links Contact Me Search Disclaimer Sitemap